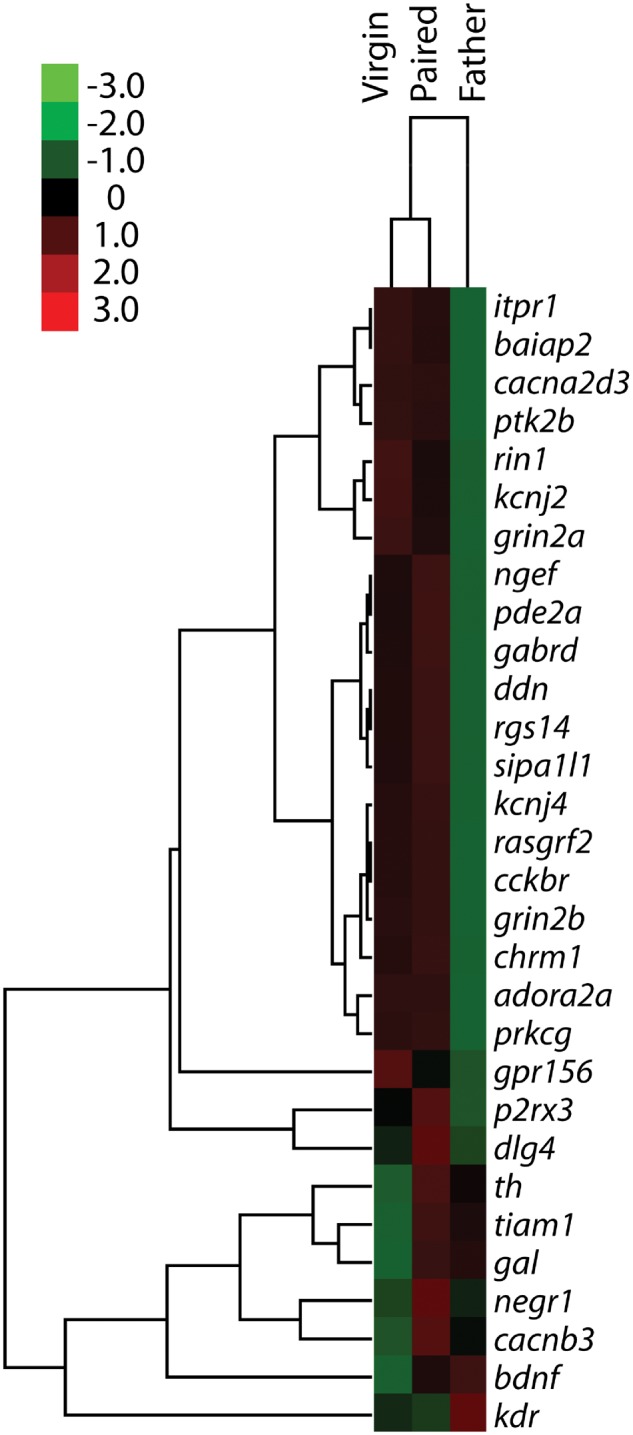
Figure 5.

heat map representing the relative expression of individual genes in virgin males, paired males, and males with fathering experience. Gene enrichment is encoded in the heat map ranging from low (green) to high (red). Genes that show similar expression patterns are clustered together, as indicated by the dendrogram to the left of the heat map
