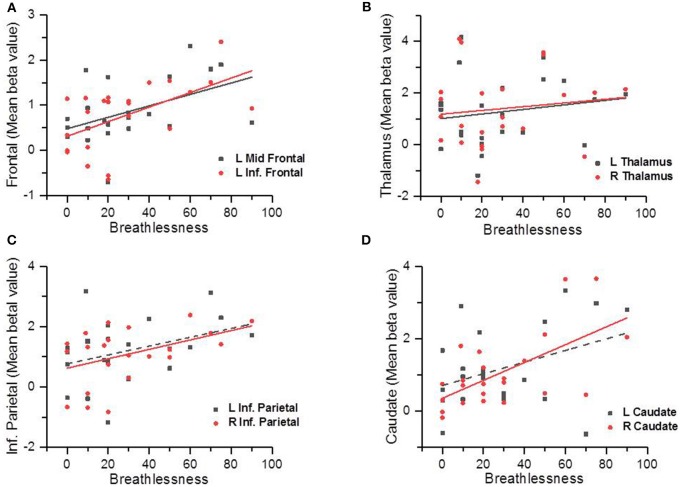
Figure 2.
Scatter plots showing the correlations between the participants' subjective ratings on breathlessness and the brain area activation levels (measured by the beta values); the solid line indicated there was a significant correlation (p < 0.05) and the dotted line indicated there was no statistically significant correlation (p > 0.05). Correlations between self-reported breathlessness level and left middle frontal cortex and left inferior frontal cortex (A), bilateral thalamus (B), bilateral inferior parietal cortices (C), and bilateral caudate (D).

