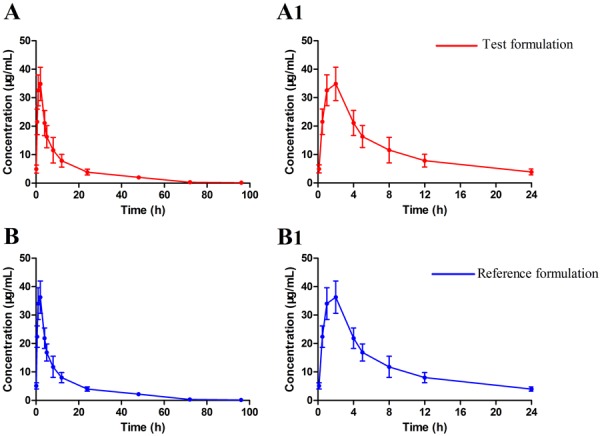
Fig. 1.

The mean plasma concentration-time curves of ceftiofur and desfuroylceftiofur-related metabolites in pigs (n=24 for each group) after a single intramuscular injection of 5 mg/kg body weight of either test formulation and reference formulation. (A) the test one in 96 hr, (A1) Amplification of A at 0–24 hr, (B) the reference one in 96 hr, (B1) Amplification of B at 0–24 hr.
