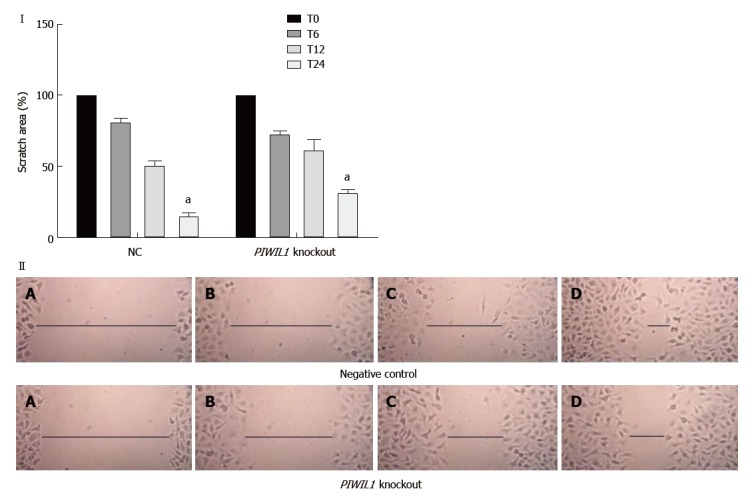
Figure 4.

Analysis of the migration capacity of the AGP01 cell line with and without PIWIL1 gene knockout. T0: Immediately after injury; T6: 6 h after injury; T12: 12 h after injury; T24: 24 h after injury. NC: Negative control. aP < 0.01. Two-way ANOVA, Bonferroni post-test. Photomicrography of AGP01 cell migration. A: Immediately after injury; B: 6 h after injury; C: 12 h after injury; D: 24 h after injury. The black lines represent approximation of the edges over time, demonstrating the migration capacity of the cells.
