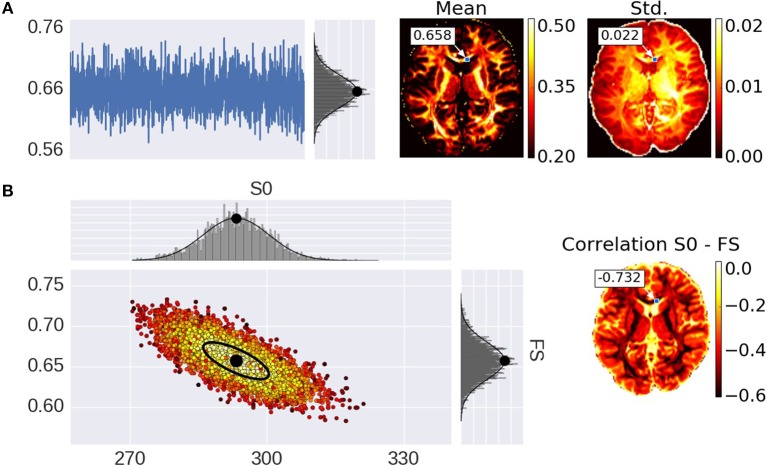
Figure 1.
Illustration of parameter uncertainty and correlation for the Ball&Stick model using MCMC sampling, with the Fraction of Stick (FS) and the non-diffusion weighted signal intensity (S0). (A) On the left, a single FS sampling trace and its corresponding histogram for the highlighted voxel with a Gaussian distribution function fitted to the samples with its mean indicated by a black dot. On the right, the mean and standard deviation (std.) maps generated from the independent voxel chains per voxel. (B) On the left, the scatter-plot for two parameters (FS and S0) with the corresponding marginal histograms for the voxel highlighted in the maps. On the right, the S0-FS correlation map.

