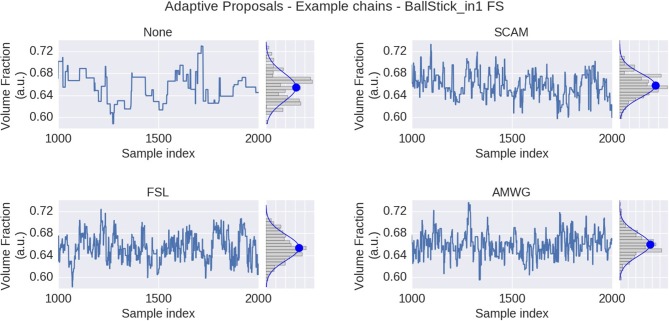
Figure 3.
MCMC sample traces for the voxel indicated in Figure 1, using Ball&Stick_in1 Fraction of Stick (FS), for no adaptive metropolis (None), the Single Component Adaptive Metropolis (SCAM), the FSL acceptance rate scaling (FSL), and Adaptive Metropolis-Within-Gibbs (AMWG) adaptive proposal methods. Results were computed with an initial proposal standard deviation of 0.25. A Gaussian distribution function was fitted to the samples, superimposed in blue on the sample histograms, with its mean indicated by the blue dot.

