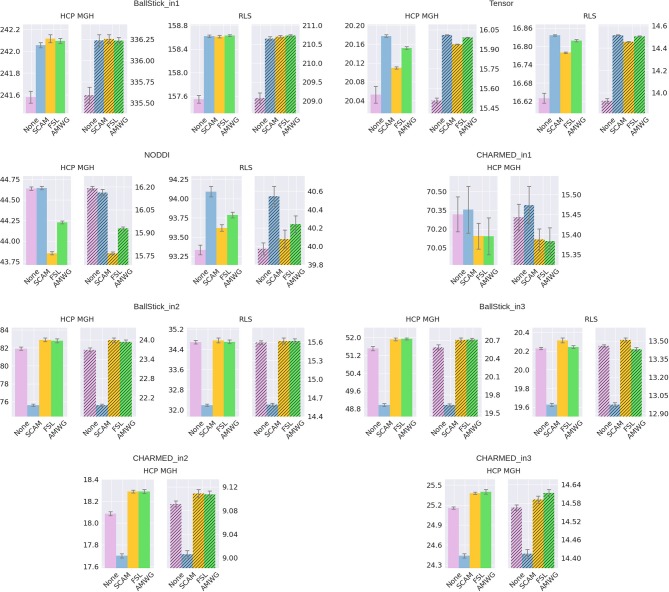
Figure 5.
Estimated accuracy (left plots) and precision (right, shaded, plots), for no adaptive metropolis (None), the Single Component Adaptive Metropolis (SCAM), the FSL acceptance rate scaling (FSL), and Adaptive Metropolis-Within-Gibbs (AMWG) adaptive proposal methods. The results are averaged over 10,000 voxels and 10 trials, the whiskers show the standard error of the mean computed over the 10 trials. Results are over 10,000 samples, without burn-in and thinning. The reported offsets need to be added to the y-axis for absolute results.

