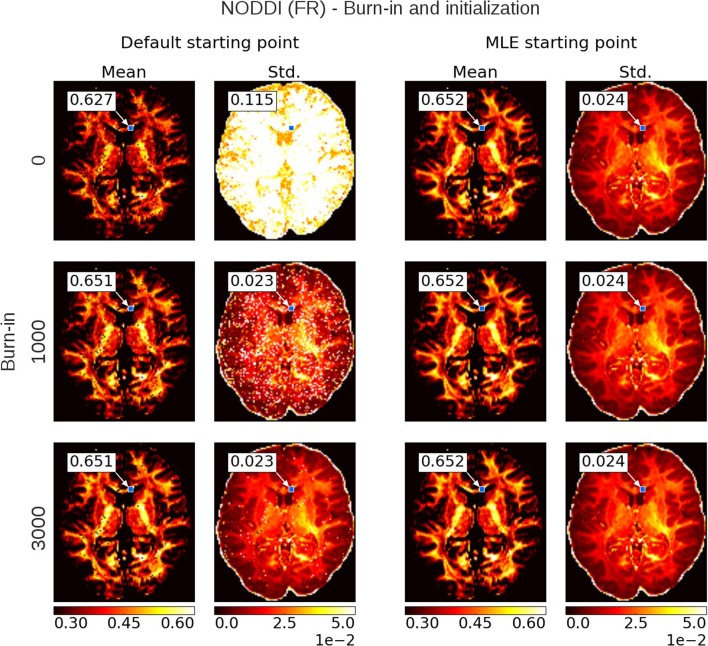
Figure 6.
Burn-in demonstration and chain initialization using NODDI Fraction of Restricted (FR). On the left, the posterior mean and standard deviation (std.) maps when sampling NODDI from the MDT default starting point, on the right the mean and std. maps when sampling NODDI using a Maximum Likelihood Estimator (MLE) as starting point. The rows show the effect of discarding the first z∈{0, 1000, 3000} samples as burn-in before the mean and std. estimation. Statistics are without thinning and over 10,000 samples after z. The value insets show the mean and standard deviation value from a Gaussian fit to the sampling chain for the indicated voxel.

