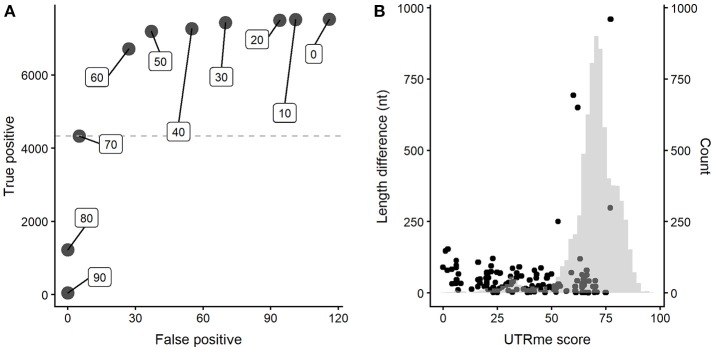
Figure 4.
UTRme accuracy assessment for 5′ UTRs. (A) Dependence of the number of true positives and false positives on the UTRme score (indicated as inserts). (B) False positive annotations are plotted as dots indicating their score and distance to the real processing site. The histogram shows the distribution of scores for all predicted sites.

