FIGURE 4.

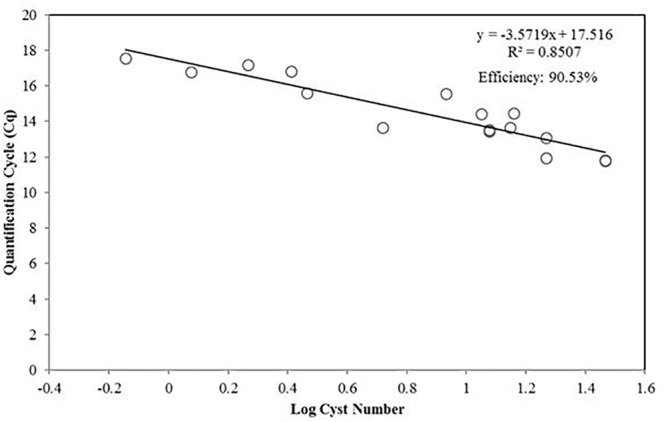
Standard curve presenting the qPCR quantification cycle value (y-axis) versus the diluted number of A. pacificum cysts in log scale.

Standard curve presenting the qPCR quantification cycle value (y-axis) versus the diluted number of A. pacificum cysts in log scale.