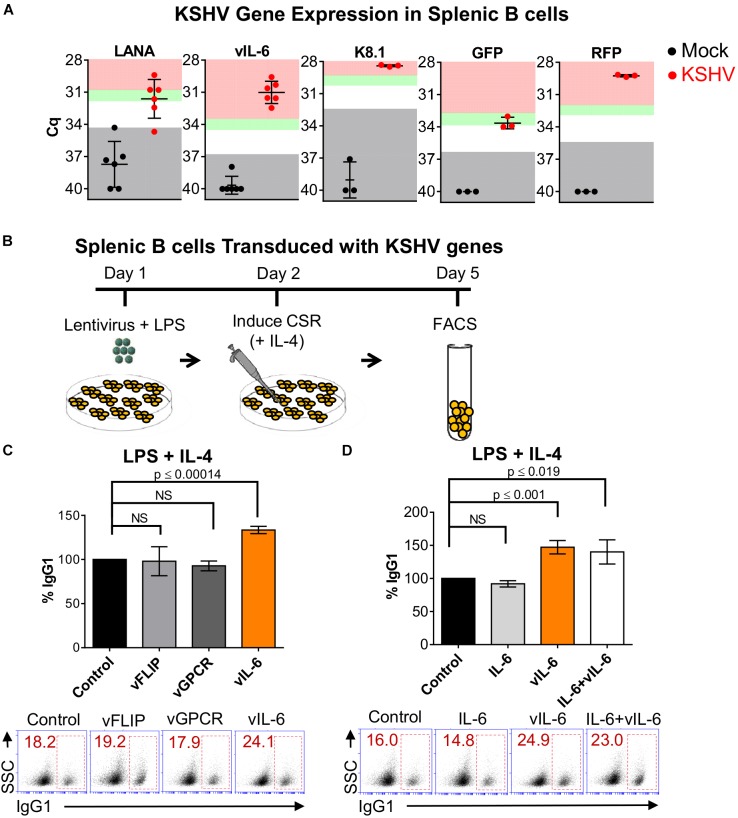
FIGURE 3.
Kaposi’s sarcoma-associated herpesvirus vIL-6 increases the efficiency of CSR. (A) Four days post-infection, qRT-PCR was used to validate mRNA transcript expression for viral genes and rKSHV.219 infection markers from LPS/ IL-4-stimulated splenocyte cell cultures that were mock infected or infected with rKSHV.219 (KSHV). Gray shading indicates values of the mock (black) or KSHV-infected (red) samples that fall at or below the threshold for the limit of detection (TLD). Green and red shading indicate values corresponding to ∼5–10-fold increase, and ≥10-fold increase, in gene expression above the TLD, respectively. The Cq value for the TLD for each target was: 34.2 for LANA, 36.92 for vIL-6, 32.48 for K8.1, 36.28 for GFP, and 35.38 for RFP. Data is representative of Cq values from splenocyte cultures from 3 to 6 mice. A two-tailed Student’s t-test revealed a significant difference between Cq values for mock-infected and KSHV-infected samples, LANA p = 0.0003, vIL-6 p = 0.0001, K8.1 p = 0.0004, GFP p = 0.0013, RFP p = 0.0001. (B) Schematic diagram depicting the strategy used to determine how expression of lentiviral plasmids coding for different KSHV viral proteins affect the efficiency of CSR in naïve mouse splenic B cells. Day 1: 5 × 10⁵ cells/mL were transduced with KSHV lentiviral plasmids from a KSHV lentiviral library. Day 2: Twenty-four hours later, B cells were stimulated for switching with LPS and IL-4 to IgG1, Day 5: surface IgG1 expression was analyzed by FACS after 4 days of stimulation. (C) Top, efficiency of class switching to IgG1 in mouse splenic B cells transduced with the pSin empty plasmid (control), or KSHV genes (vFLIP, vGPCR, or vIL-6) and stimulated for 4 days with LPS and IL-4. Bottom, (A) representative FACS plot displaying the percentage of splenocytes that class-switched to IgG1+ (inside red rectangle) is shown. (D) Top, efficiency of class switching to IgG1 in mouse splenic B cells transduced with the pSin empty plasmid (control), or KSHV vIL-6 (vIL-6), or treated with exogenous murine IL-6 (IL-6), or concomitantly transduced with KSHV vIL-6 and treated with murine IL-6 (IL-6+vIL-6) and stimulated for 4 days with LPS and IL-4. Bottom, (A) representative FACS plot displaying the percentage of splenocytes that class-switched to IgG1+ (inside red rectangle) is shown. Values on the graphs in (B,C) show the percentage of IgG1+-switched cells (% IgG1) relative to the control.

