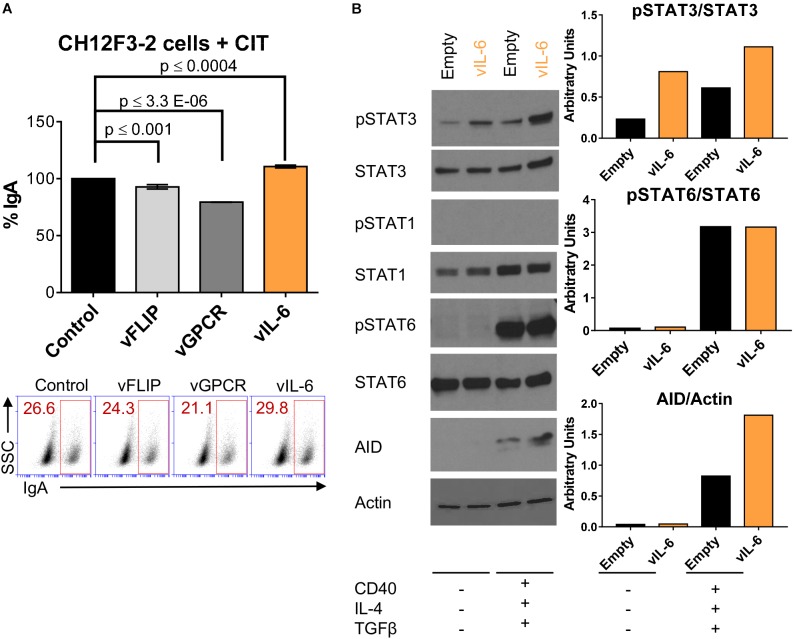
FIGURE 4.
vIL-6 increases phosphorylation of STAT3 and AID expression in B cells stimulated for CSR. (A) A representative experiment quantifying CSR to IgA after 24 h of CIT stimulation (+CIT) in CH12F3-2 cells transduced with the pSin plasmid (control), and KSHV genes (vFLIP, vGPCR, and vIL-6). Values on the graph show the percentage of IgA+ cells (% IgA) relative to the control. Below, (A) representative FACS plot displaying the percentage of CH12F3-2 cells that switched to IgA (inside red rectangle). (B) Left, Western blot images of total extract from CH12F3-2 cells transduced with the pSin plasmid (Empty) or with KSHV vIL-6 (vIL-6) and stimulated for 24 h without (–) or with (+) αCD40, IL-4, and TGFβ to induce CSR to IgA. Right, Graphs showing quantification in arbitrary units of phospho-STAT3 relative to total STAT3 (pSTAT3/STAT3), phospho-STAT6 relative to total STAT6 (pSTAT6/STAT6) and AID relative to Actin (AID/Actin).

