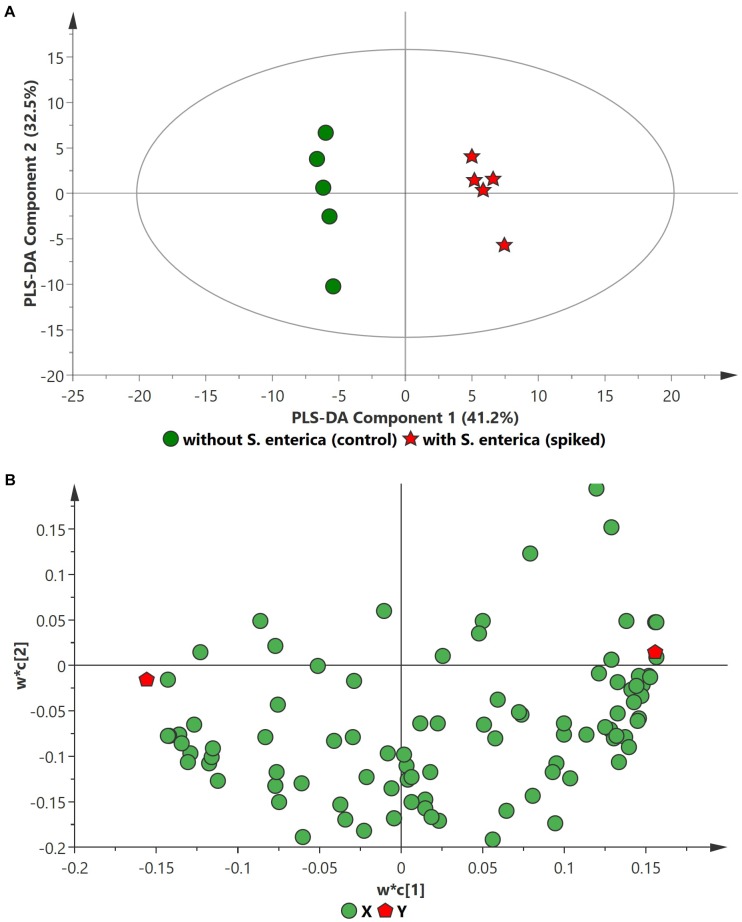
FIGURE 3.
PLS-DA scatter plots of S. enterica inoculated in enriched selective media containing beef sample. (A) PLS-DA Score scatter plot (R2X = 83.5%, R2Y = 100%, Q2 = 97.8%). Green circles (•) indicate data obtained from control beef samples and red stars (★) indicate data from spiked beef samples after 18 h of incubation for S. enterica. The PLS-DA ellipse (solid line) represents the 95% confidence interval. (B) PLS-DA Loading scatter plot.

