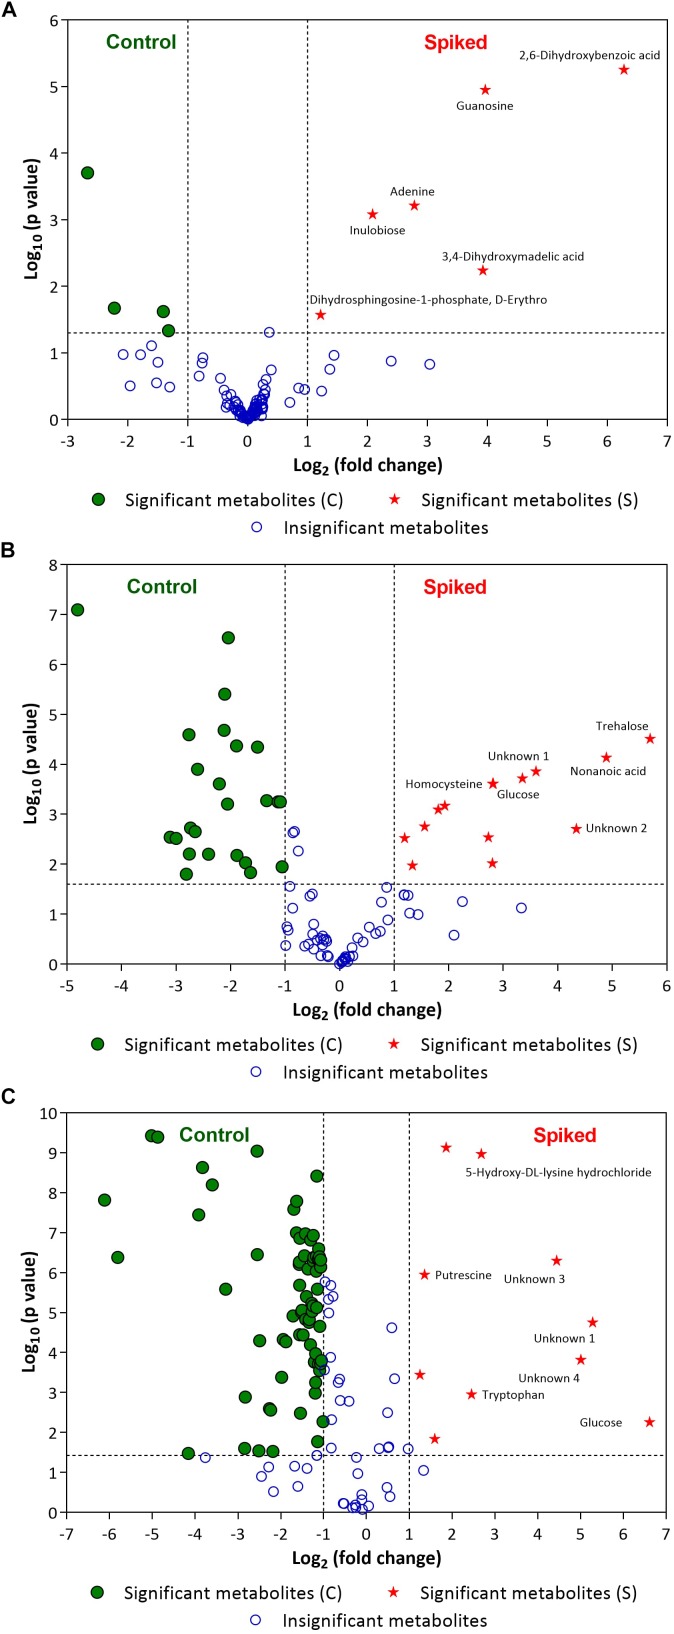
FIGURE 5.
Volcano plots of (A) L. monocytogenes, (B) S. enterica and (C) E. coli O157:H7 enriched in selective media containing the minced beef samples. Green circles (•) and red stars (★) indicate statistically significant putative biomarker metabolites found in control beef samples and spiked meat samples, respectively, after specified period of incubation (For L. monocytogenes: 24 h; for S. enterica: 18 h and E. coli O157:H7: 12 h). A few statistically significant metabolites in spiked samples are labeled in the volcano plots (see Tables 2–4 for top ten statistically significant metabolites). Please refer to Supplementary Information for list of other statistically significant metabolites. Blue open circles (∘) indicate metabolites that are not statistically significant for the discrimination (see Supplementary Information). The dashed lines on the volcano plot represent a p-value of 0.05 (Y-axis) and a fold change of 2 (X-axis).

