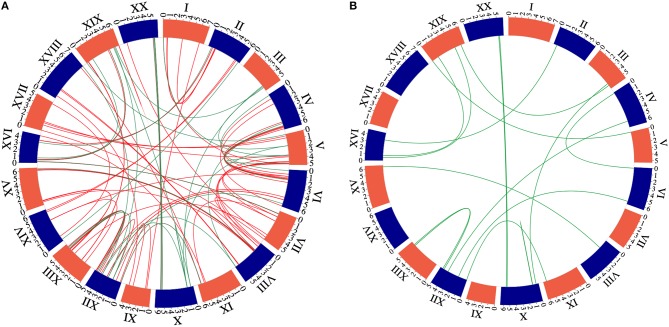
Figure 3.
Circle plot of the soybean chromosomes and the GmNAC family. A. Circle plot of the soybean chromosomes showing the location of the new 32 NACs genes compared with the former NAC group. The green color represents 21 new NAC genes presented at the pairs of paralogous comparing with all NAC genes. We used the criterion of 80% identity to recover the paralogous pairs. B. Circle plot of soybean chromosomes and the 21 newly identified NAC genes displayed as duplicated gene pairs based on the phylogenetic analysis.

