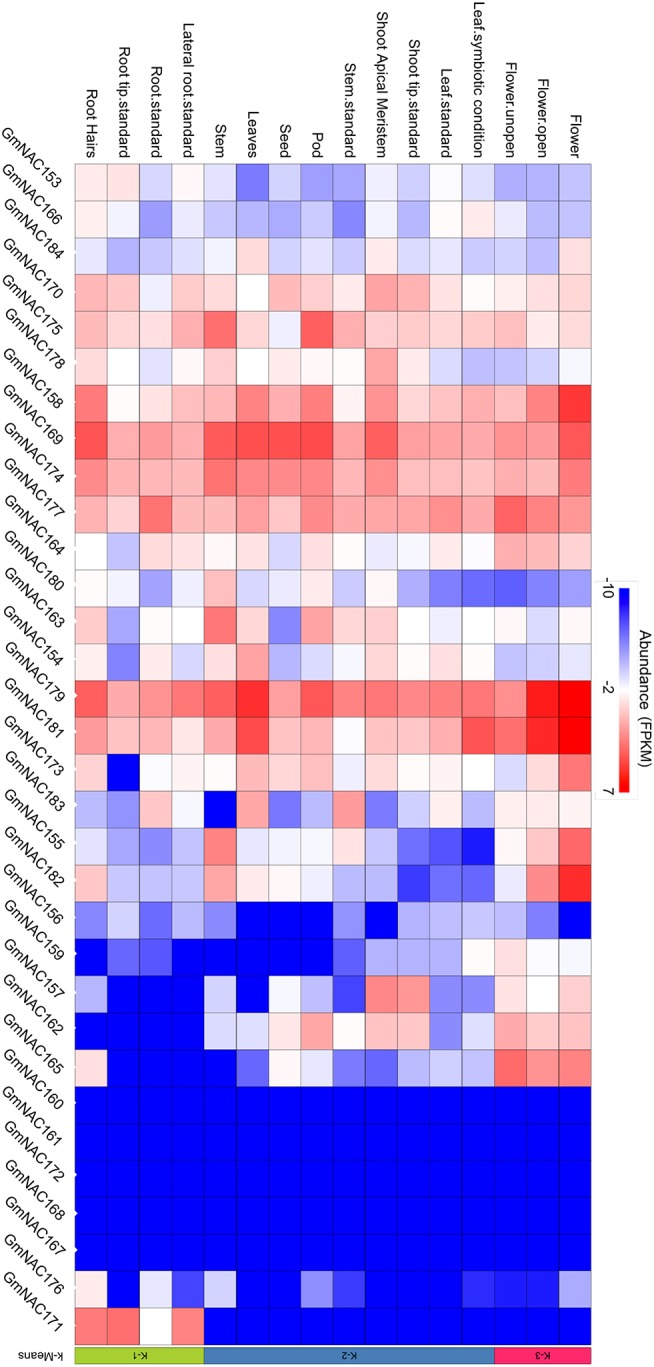
Figure 4.

Organ and tissue-specific expression of the new NAC genes. The heat map plot was created by the PhytoMine tool (https://phytozome.jgi.doe.gov/phytomine/begin.do) presented at the Phytozome v12 website (https://phytozome.jgi.doe.gov). The heat map was built using all gene expression data at the database regarding tissue- and organ-specific expression.
