Figure 6.
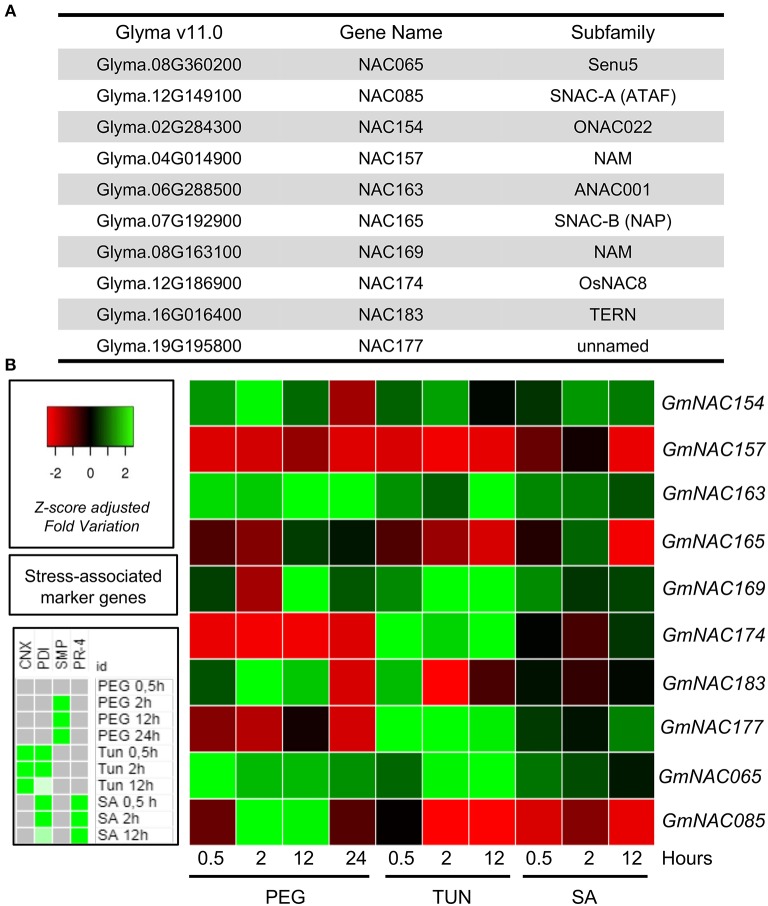
Expression patterns of new GmNACs during multiple stress. (A) The identity of the selected GmNAC genes. (B) Heatmap of the stress-induced expression of 8 new putative GmNAC genes, GmNAC065 and GmNAC85. For the expression analysis of randomly selected GmNACs, soybean seedlings were stressed with PEG (10%), tunicamycin (5 μg/mL) and salicylic acid (5 mM) for 0.5, 4 and 12 h (24 h, exclusively for PEG treatment) and the transcript accumulation was monitored by qRT-PCR. The UNK-2 gene was used as endogenous control, and gene-associated stress markers were used to monitor the effectiveness of treatment (on the left). The data presented in the figure comprise the qRT-PCR from Supplementary Figures 4, 5 and Supplementary Table 6.

