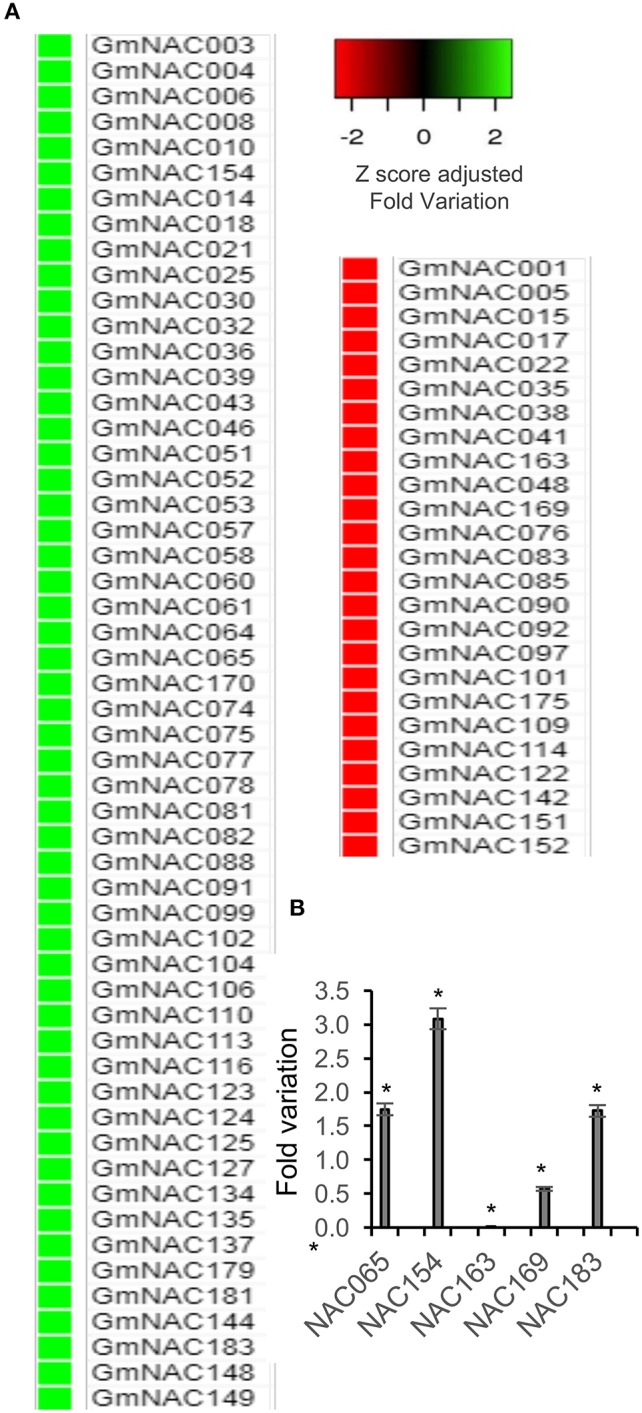
Figure 7.

Expression profile of NAC genes during natural leaf senescence in soybean. (A) Heatmap of senescence-associated GmNAC genes. The data presented in the figure comprise an RNA-seq analysis showing the differential expression of NAC genes in BR16_80d (R7)-BR16_20d(V3). (B) Senescence-induced variation of expression for representative senescence-associated NAC genes. Total RNA was isolated from 20 DAG to 80 DAG soybean leaves and the transcript accumulation of the indicated genes was measured by qRT-PCR. UKN-2 was used as the normalizer, endogenous control gene. Relative gene expression was quantified using the comparative 2−ΔΔCt method. The bars indicate standard-error and the asterisks indicate statistical significance by the t-test, (P < 0.05, n = 3).
