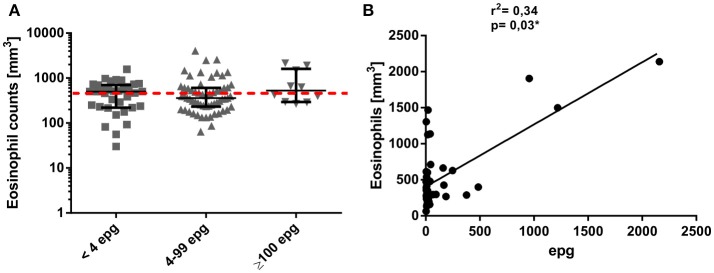
Figure 2.
Individual eosinophil counts (mm3) in different S. mansoni infection groups (A). Groups were classified according to their individual egg counts by six Kato-Katz slides into median to high (≥100 epg) or low (4 to 99 epg) parasite load, or into <4 epg, according to more sensitive, qualitative detection methods. The dotted red line indicates the limit of normal eosinophil counts in clinical samples (range 0–500 mm3). Association between peripheral blood eosinophil counts and egg counts per gram of feces, as determined by Kato-Katz (B).

