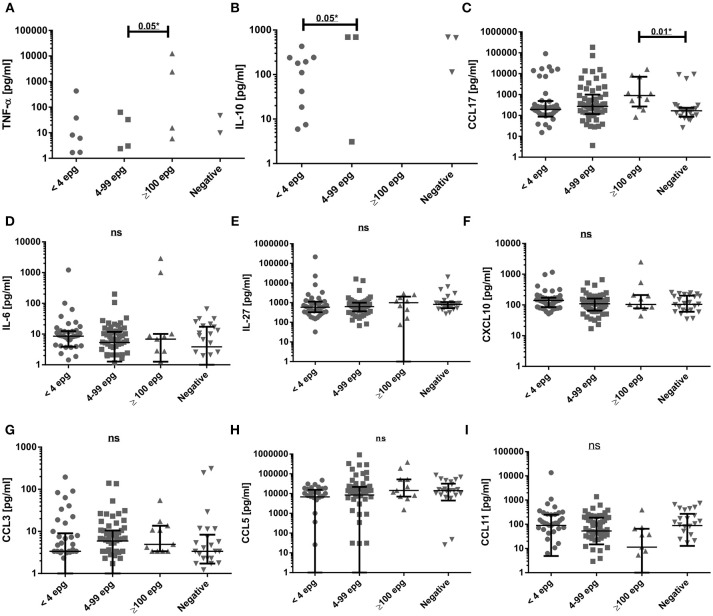
Figure 3.
Comparison of serum cytokine and chemokine concentrations (pg/ml) in different S. mansoni infection groups. Groups were classified according to their individual egg counts into median to high (≥100 epg; n = 11) or low (4 to 99 epg; n = 60) parasite load, or into <4 epg (n = 42) and compared with egg-negative individuals (n = 26). Shown are results for TNF-α (A), IL-10 (B), CCL17 (C), IL-6 (D), IL-27 (E), CXCL10 (F),CCL3 (G), CCL5 (H), CCL11 (I). Indicated were median values and 25 and 75% interquartile ranges and data were analyzed with Kruskal-Wallis test and Dunn's post-test. Not significant differences (ns: p ≥ 0.05) and significant differences between groups (*p ≤ 0.05) were indicated.

