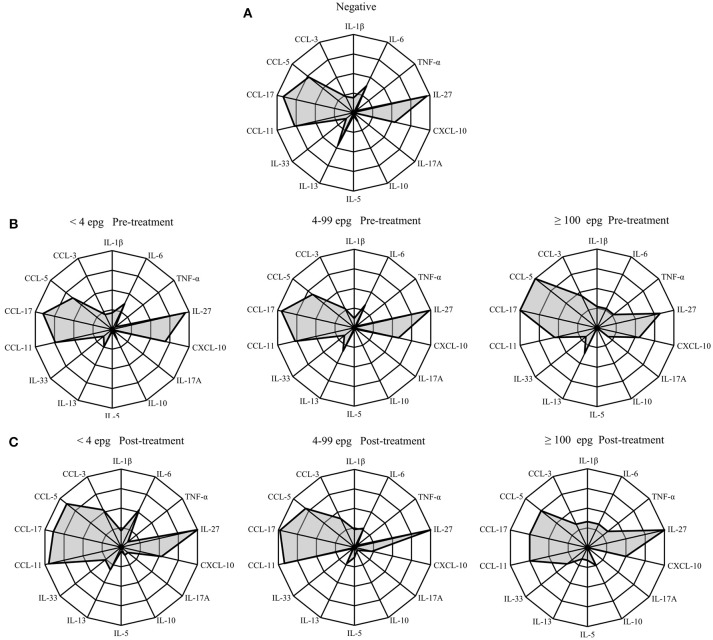
Figure 5.
Radar profile for cytokines and chemokines in individuals infected with S. mansoni, compared with egg-negative individuals at pre-treatment (A,B), and 3 months post-treatment (C). Infection groups were classified according to different parasite loads in <4 epg, 4–99 epg and ≥100 epg. Indicated radar zones correspond to 25, 50, 75, and 100 percent values. Radar indicates percentage of responders in each infection group before and 3 months post-treatment and in comparison with endemic egg-negative individuals.

