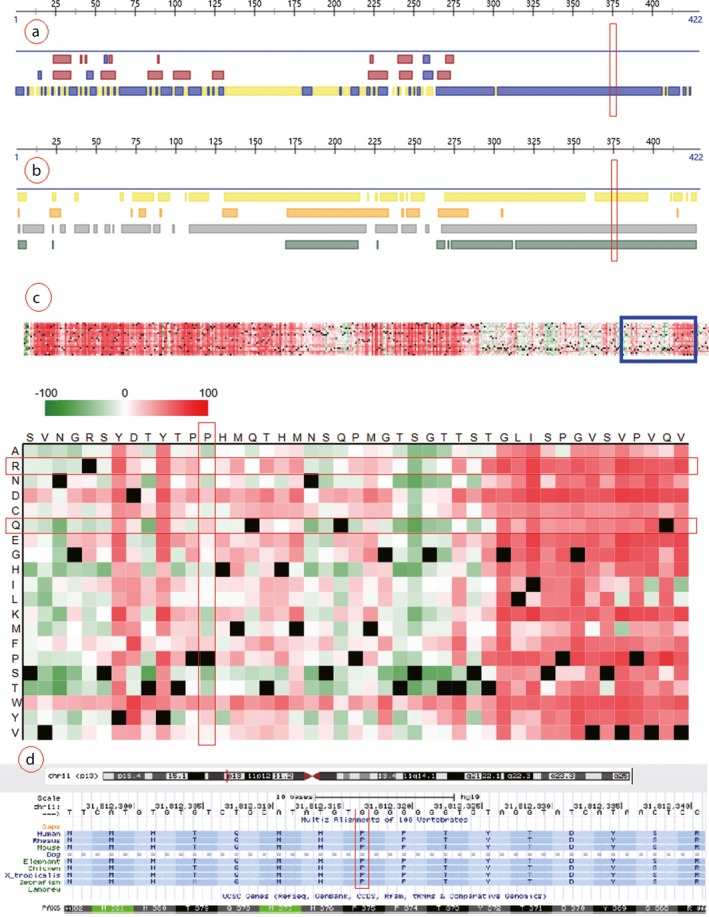
Figure 12.

Prediction analysis of the PAX6 c.1124C>G (p.P375R) missense mutation. Note: Part a presents the result of structure prediction; the mutated site hit third row in which yellow block indicated buried and blue block indicated exposed that calculated by PROF algorithm. Part b presents the result of disorder prediction; the color blocks indicate disorder region and the four rows were calculated by methods of PROFbval, Ucon, NORSnet, and MD, respectively. Part c presents the point effect of c.1124C>G (p.P375R); the horizontal axis and vertical axis stand for normal amino acid sequence and amino acid replacements, the dark red, green, and black indicate damaging, benign, and wild type, respectively. Part d presents the conservation of amino acid sequences corresponding to c.1124C>G mutation of PAX6 between species
