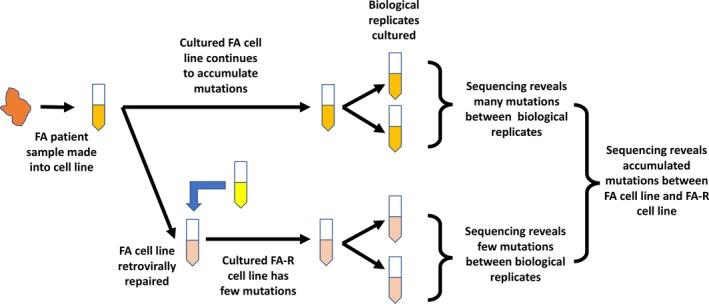
Figure 1.

Two Fanconi anemia (FA)—PD20 cell lines were included in this experiment. The cell lines represented in yellow are FA cell lines with a dysfunctional FANCD2 gene, while the cell lines represented in pink are FA cell lines that were corrected with a functional FANCD2 gene using retroviral transduction. Variants with respect to the human genome reference found in common among all samples are indicative of variants accumulated prior to extraction from the patient and differences between this individual and the reference. Variants specifically distinguishing the FA and FA_RV sample groups are indicative of the divergence that likely occurred after retroviral correction in the FA_RV sample group. Variant differences within the sample groups (cell culture replicates) indicate the divergence of each of the cell line cultures, as different uncorrected errors accumulate in each sample
