Figure 3.

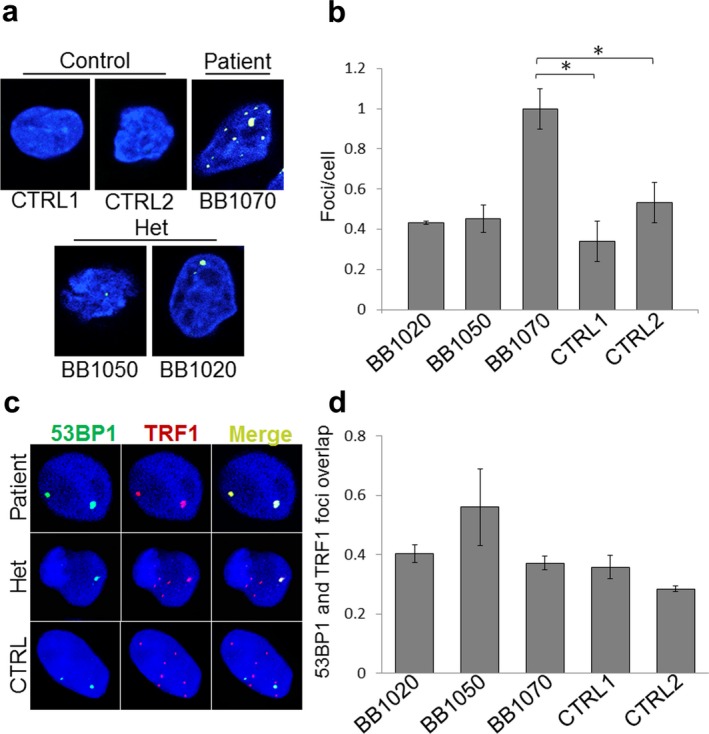
Accumulation of DNA damage foci in CTC1 mutant LCLs. (a) Immunostaining of 53BP1 (green) counterstained with DAPI staining for DNA (blue). Representative pictures of cells from the patient, 2 heterozygotes, and 2 controls are shown. (b) Average number of 53BP1 foci per cell is calculated for each LCL. * indicates p < 0.05. A total of approximately 200 cells were analyzed for each experiment. (c) Sub‐nuclear localization of 53BP1 foci. Co‐immunostaining of 53BP1 (green), telomere binding protein, TRF1 (red), and DNA (using DAPI, blue) were done in control and CTC1 mutant cells. (d) Correlation between 53BP1 and TRF1 signals. Calculated Pearson's Coefficients are shown as measures of the linear correlations between 53BP1 and TRF1 signals. Values are shown between +1 and −1; +1 for completely positive linear correlation and −1 for completely negative linear correlation. Approximately 100 cells were analyzed for each cell line. Het stands for heterozygous and CTRL stands for control
