Figure 4.

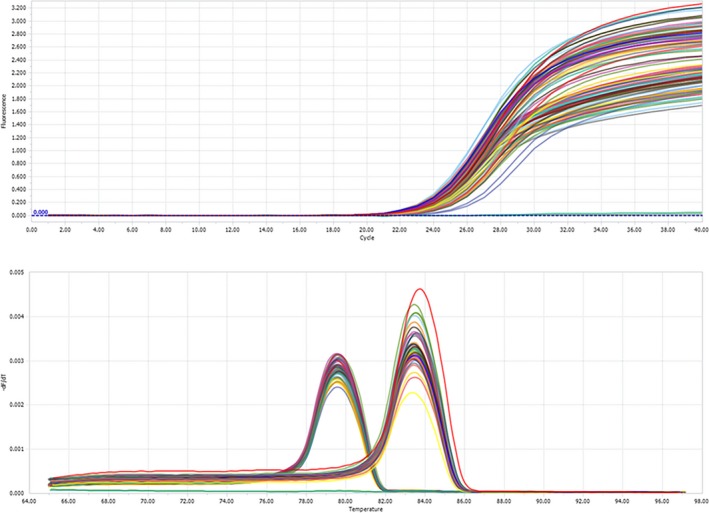
Quantitative real‐time PCR (qPCR) results. (a) Amplification curves. (b) Melting peaks. Exon 1 (at 83.5°C), Exon 14 (at 79.5°C)

Quantitative real‐time PCR (qPCR) results. (a) Amplification curves. (b) Melting peaks. Exon 1 (at 83.5°C), Exon 14 (at 79.5°C)