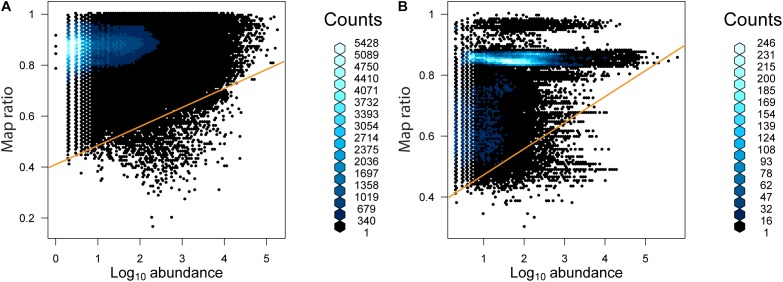
FIGURE 5.
The abundance of unique reads as a function of map ratio for (A) bacteria and (B) archaea. The abundance of unique reads was determined within each consensus environment (i.e., each unique read may be tallied more than once in different consensus environments). The distribution of data is displayed via a hexagonal density plot, with the color of the hexagons representing the density of the data.

