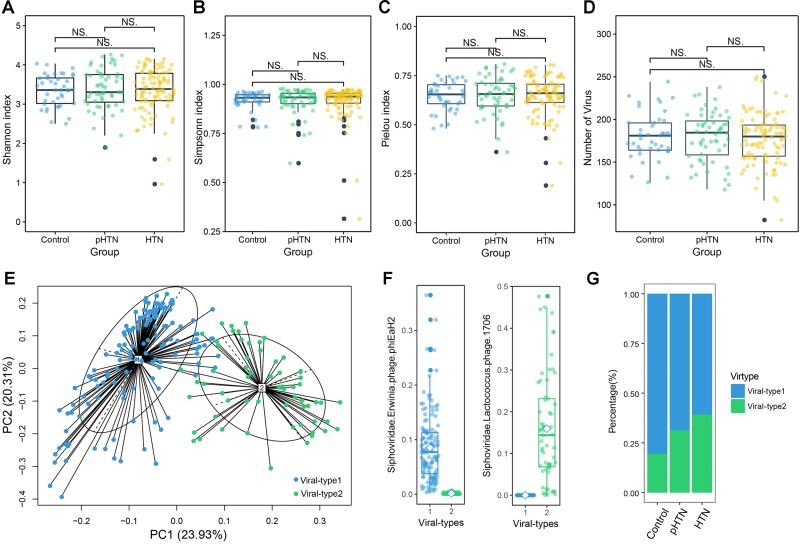
FIGURE 2.
Viral diversity and the gut viral-types of gut microbial communities. Comparison of the α diversity indexes, assessing by (A) Shannon index, (B) Simpson index, (C) Pielou index, and (D) the number of viruses, based on the viral profiles in control, pHTN, and HTN groups. NS represents no significant difference. These indexes are not significantly different among these three groups (Wilcox test, all p > 0.05). (E) The planar projection and viral-types of 196 samples visualized by the PCoA. A total of 196 samples were classified into viral-type 1 (wathet) and viral-type 2 (cyan) by PCoA of Jensen–Shannon distance based on the viral composition. The most enriched virus in two viral-types is Erwinia phage phiEaH2 and Lactococcus phage 1706, respectively. (F) Relative abundances of the top viruses (Erwinia phage phiEaH2 and Lactococcus phage 1706) in each viral-type. (G) The percentage of control, pHTN, and HTN samples distributed in the two viral-types.

