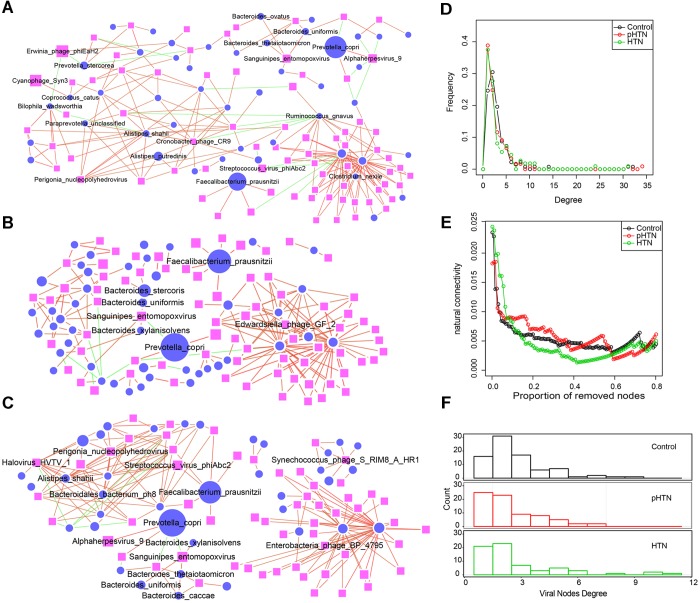
FIGURE 5.
Comparison of virus-bacteria co-occurrence networks among control, pHTN, and HTN groups. Virus-bacteria co-occurrence networks for (A) control, (B) pHTN, and (C) HTN groups. Network nodes represent virus and species. Ellipse represents species of bacteria and rectangle represents virus. Edges represented positive associations (red) and negative associations (green) between virus and bacteria at the species level. Each node represents a bacteria or a virus and its size is proportional to the mean relative abundance within the group. The cutoff of the Spearman correlation and the FDR-corrected p-value were set at 0.5 and 0.05, respectively. Comparison of (D) degree distributions of virus-bacteria co-occurrence networks of these three groups. (E) Comparison of destroying degree of virus-bacteria co-occurrence network of these three groups based on the proportion of removed modes. (F) Comparison of differences of viral nodes degree of virus-bacteria co-occurrence network of these three groups.

