FIGURE 9.

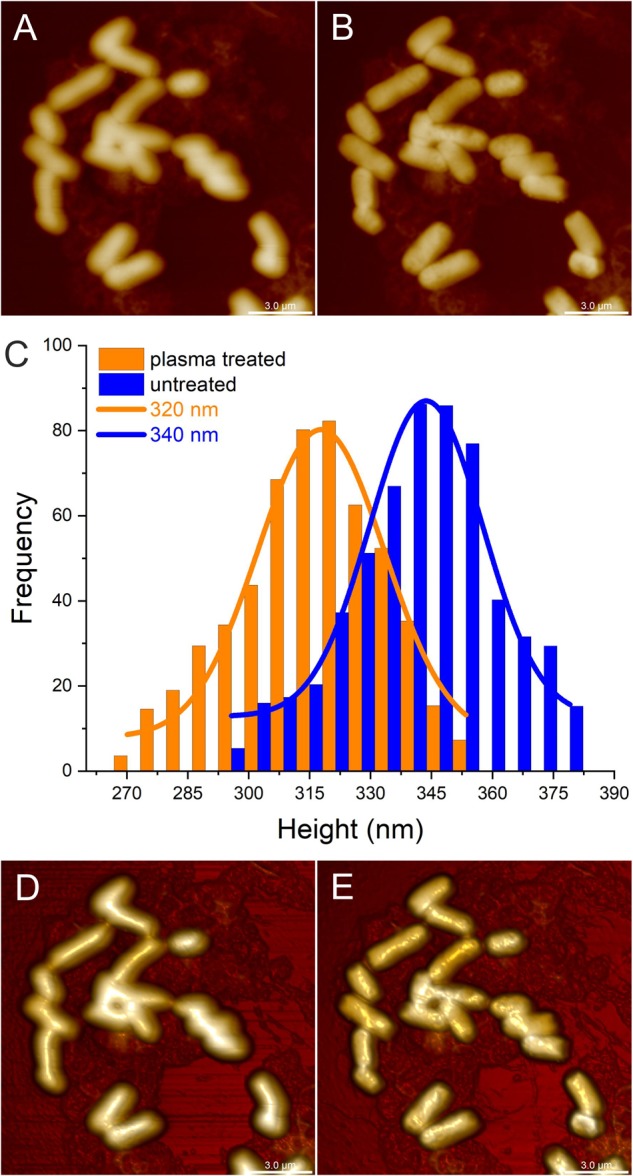
Atomic force microscopy (AFM) imaging of identical Escherichia coli cells on a microscopic slide before and after cold atmospheric pressure plasma (CAPP) treatment in the DCSBD system. The upper panel of images represents 2D scans from untreated E. coli cells (A) and after 1 min (B) CAPP treatment as directly generated by AFM. Plot C shows the respective height distribution for untreated E. coli cells (blue columns) and E. coli cells after 1 min CAPP treatment (orange columns), where the frequency represents the number of E. coli cells with a certain height. In comparison to the average height of 340 nm determined for untreated E. coli cells (blue line), the average height of E. coli cells after 1 min CAPP treatment was decreased by 20 nm resulting in an average height of 320 nm (orange line). The 3-dimensional scans from untreated E. coli cells (D) and cells after 1 min CAPP treatment (E) allow better visualization of the surface of the E. coli cells and revealed an increase in the roughness of the cell surface after plasma-treatment. All scale bars represent 3 μm.
