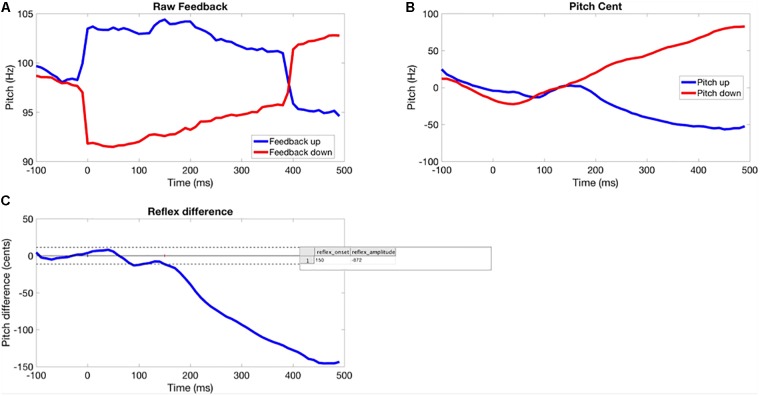
FIGURE 1.
Method for extracting the time course of the perturbation response for each participant. (A) Pitch-shifted feedback averaged across perturbation trial. (B) Participant’s normalized baseline and opposing responses. (C) Averaged difference between response to upward and downward shifts (solid horizontal line showing average baseline response, dotted lines are ±2 SD, response onset is where the signal crosses the 2 SD line for >100 s.

