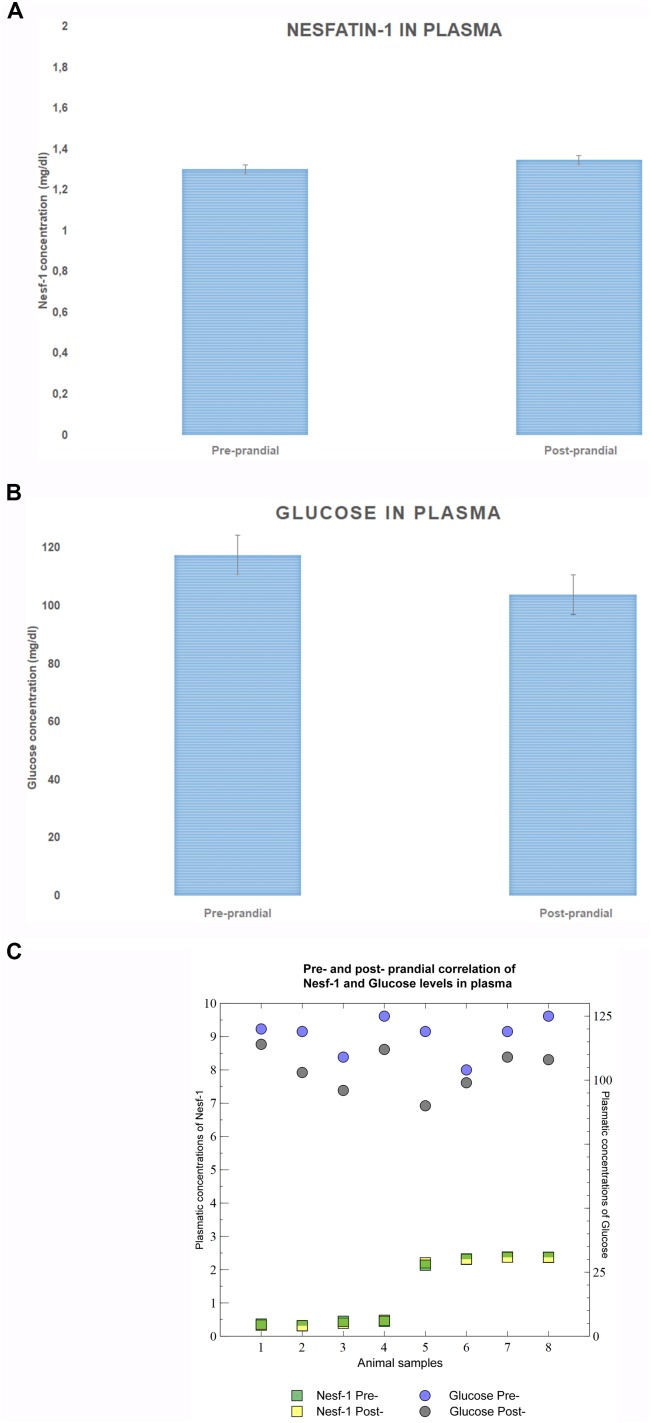
FIGURE 2.
Nesf-1 and glucose plasma levels. (A) Plasma Nesf-1 concentrations didn’t show differences during fasting and post-prandial states. (B) Plasma glucose levels measured during fasting are significantly higher than those post-prandial states (T-test p < 0.01). (C) Pearson correlation coefficient was used to display a slight inverse linear correlation between Nesf-1 and glucose plasma concentration (rpre-prandial = –0.012; rpost-prandial = –0.026).

