
FIGURE 6.
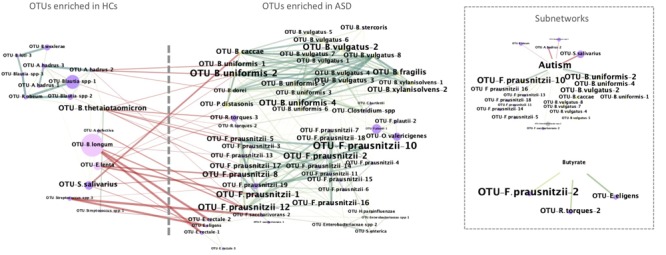
Co-occurrence network analysis of identified key OTUs and their correlation with level of ASD and butyrate. In the networks: OTUs and samples’ properties (ADOS score and fecal butyrate concentration) are depicted as nodes; an edge represents a spearman correlation with a correlation coefficient > 0.5 (green) or < -0.5 (red) that is statistically significant (FDR < 0.05); the size of each node represents the relative abundance, while the size of each label node is proportional to its degree (the number of edges and nodes connected to each node); the colors of nodes represent their classification at phylum level (pink, Actinobacteria; yellow, Bacteroidetes; violet, Firmicutes; gray, Proteobacteria). In the Supplementary Tables S2, S3 are reported the significant nodes and edges, respectively.