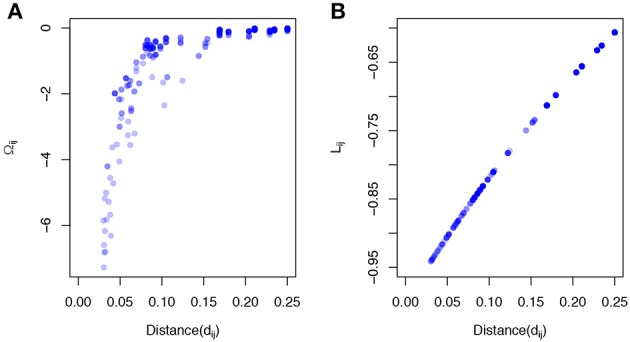
Figure 1.

Local smoothing effects of the proposed smoothness penalty. The data was generated based on a simulated phylogenetic tree (p = 200,“rcoal” from R “ape” package). The correlation C(α) was calculated based on the pairwise patristic distances with α = 2. (A) The elements of inverse correlation matrix (Ωij) are plotted against pairwise patristic distances (dij). (B) The elements of Laplacian matrix (Lij) are plotted against pairwise patristic distances (dij).
