
Figure 2.
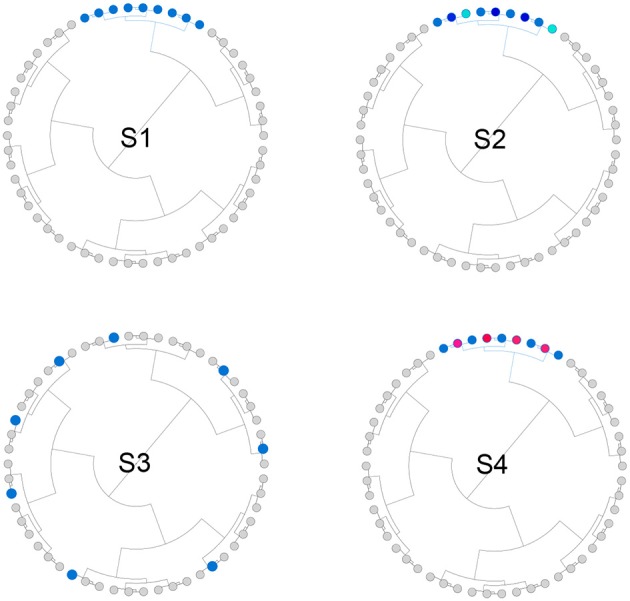
Illustration for the simulation strategy. We simulated both phylogeny-informative scenarios (S1 and S2) and phylogeny-non-informative scenarios (S3 and S4). Blue and red color indicate the direction of the effect while the darkness of the color indicates the magnitude of the effect.