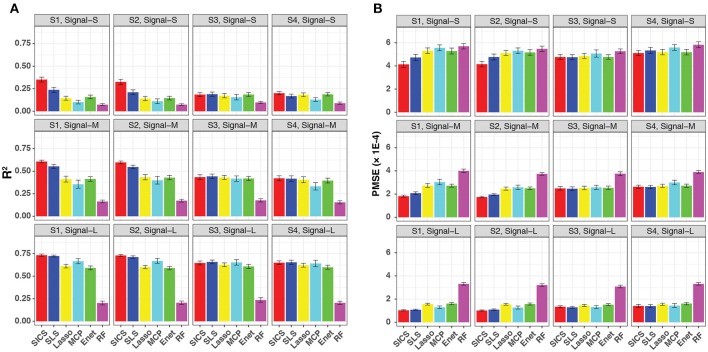
Figure 3.
Prediction performance for continuous-outcome simulations across different signal levels and scenarios. Both R2 (A) and PMSE (B) were used for evaluation. S1, S2: phylogeny-informative scenarios, and S3, S4: phylogeny-non-informative scenarios; Signal-S, -M, and -L represent weak, medium and strong signals, respectively.

