
Figure 5.
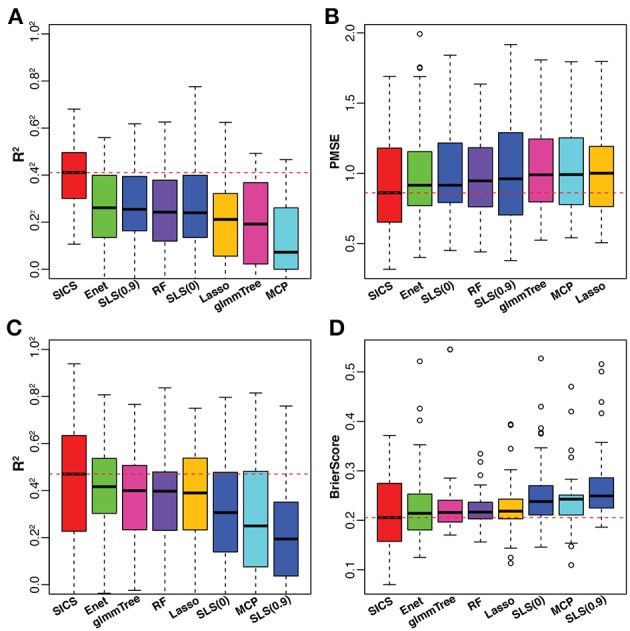
Performance comparison on the caffeine intake data (A,B) and smoking data (C,D). The red dashed line indicates the median value of various performance measures for SICS. SLS(0): SLS without sparsification; SLS(0.9): SLS with 90% sparsity level in the Laplacian matrix.