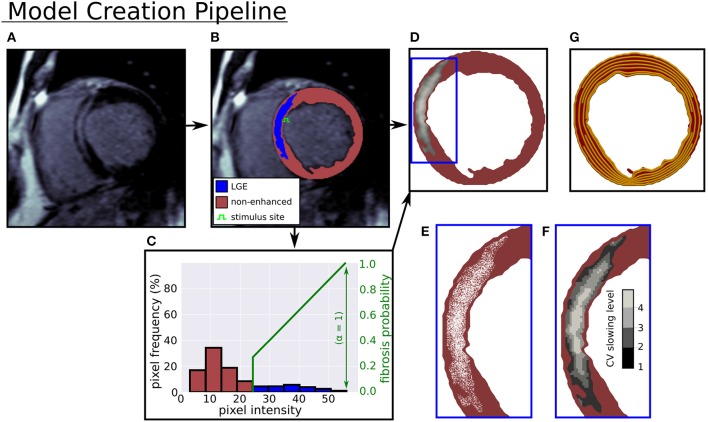
Figure 1.
Computational model creation from an LGE-CMR image. (A) LGE-CMR image. (B) Image segmentation into enhanced and non-enhanced myocardium. (C) LV myocardial pixel intensity histogram and example intensity to fibrosis probability mapping. (D) Computational model with LGE intensities registered to image. (E) Zoomed in view of simulated fibrosis micro-structure. (F) Four conduction slowing zones in LGE. (G) Rule-based circumferential fibers.

