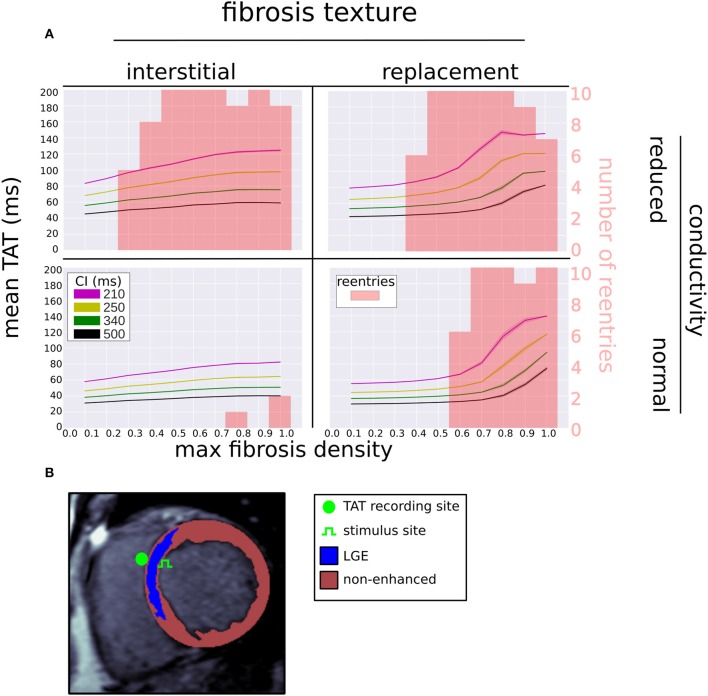
Figure 6.
(A) Mean (solid line) and standard deviation (transparent area) of trans-septal activation time (TAT) for four coupling intervals (CI) vs. fibrosis density, fibrosis type, and LGE conductivity. The reentry incidence is overlaid in red. (B) Segmented LGE-CMR image with locations of stimulus and TAT recording site.

