
FIGURE 2.
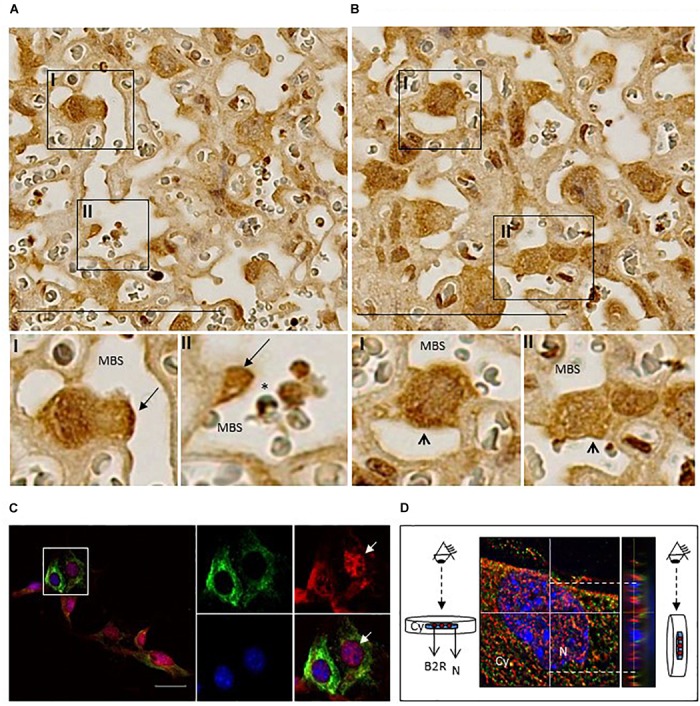
Localization of B2R protein expression in placentas and cultured trophoblasts. (A) Immunohistochemistry of infected placentas showing B2R expression in mononuclear trophoblasts protruding to MBS (arrow; I and II) and in (B) Coan-Burton bridges (arrowhead; I and II); scale bar: 100 μM; (C) Immunofluorescence analysis of cultured trophoblasts from NI placentas; trophoblasts were stained with anti-KRT7-PE (green), anti-B2R-Cy5 (red), and DAPI (blue) and analyzed by fluorescence microscopy (Leica DMRA2); scale bar: 40 μM. The area depicted in the figure is magnified to show individual and merged staining; arrow shows B2R nuclear expression which was confirmed by (D) orthogonal views of stack imaging (acquired by Leica High Content Screening microscope) using ImageJ program; Cy, cytoplasm; N, nucleus.