FIGURE 3.
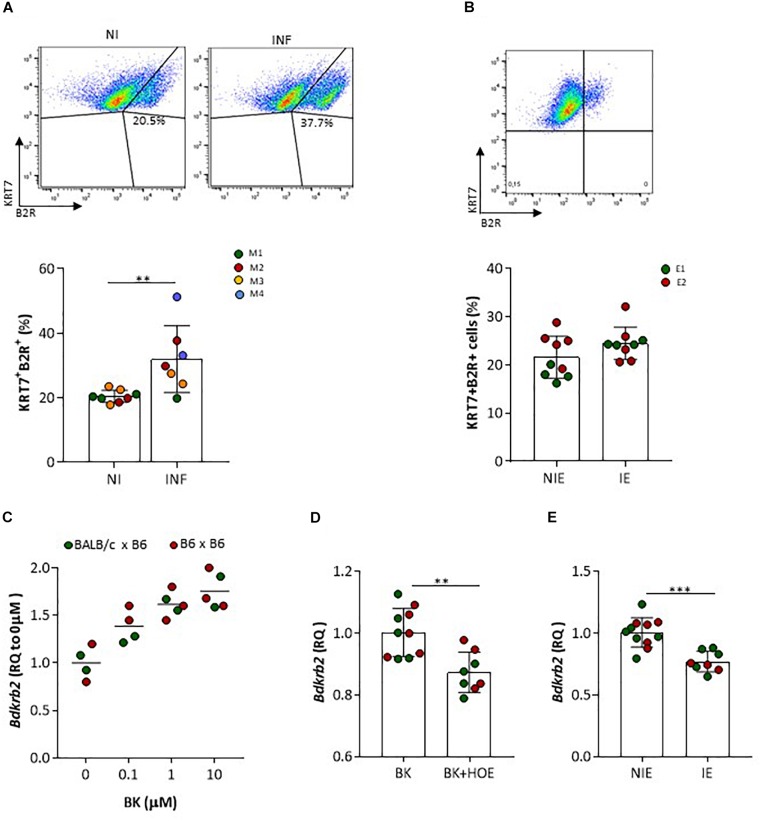
B2R protein and gene expression in trophoblasts. (A) Representative FACS plots of placental KRT7+B2R+ cells isolated from NI or INF pregnant mice; results from 8 NI and 7 INF placentas are compared by Unpaired t test; each dot represents one placenta [color of placentas matches color of the mother (M)]; (B) FACS plot of B2R+ trophoblast (KRT7) isolated from normal placenta cultured for 7 days in the absence of erythrocytes (upper panel); percentage of B2R+ trophoblast in serum-free conditions after incubation with non-infected erythrocytes (NIE) or infected erythrocytes (IE) for 4 h; results from 4 to 5 replicates per experiment, from 2 independent experiments (E1 and E2) are compared by Unpaired t test (lower panel). Trophoblasts were washed, stained for KRT7 and B2R surface expression and analyzed by FACS. (C) Bdkrb2 mRNA transcription in cultured trophoblasts from allogeneic (BALB/c × B6) or syngeneic (B6 × B6; only for this experiment) pregnancies treated with BK in vitro or (D) BK in the absence or presence of HOE-140 or (E) incubated with NIE or synchronized IE in 2% FBS. Trophoblasts were expanded in culture and incubated with stimuli for 4 h. HOE-140 was added to trophoblasts 15 min before BK, NIE, or IE; ∗∗p < 0.01, ∗∗∗p < 0.001 (Unpaired t test).

