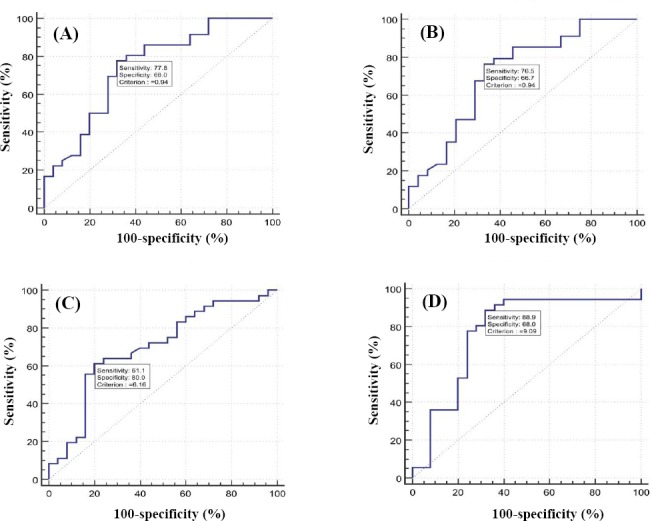
Fig. 2.

ROC curve analysis using different miRNAs for discriminating GC from normal tissue. ROC curves were constructed to show the specificity and sensitivity of miR-21 (A), miR-25 (B), miR-93 (C), and miR-106b (D).

ROC curve analysis using different miRNAs for discriminating GC from normal tissue. ROC curves were constructed to show the specificity and sensitivity of miR-21 (A), miR-25 (B), miR-93 (C), and miR-106b (D).