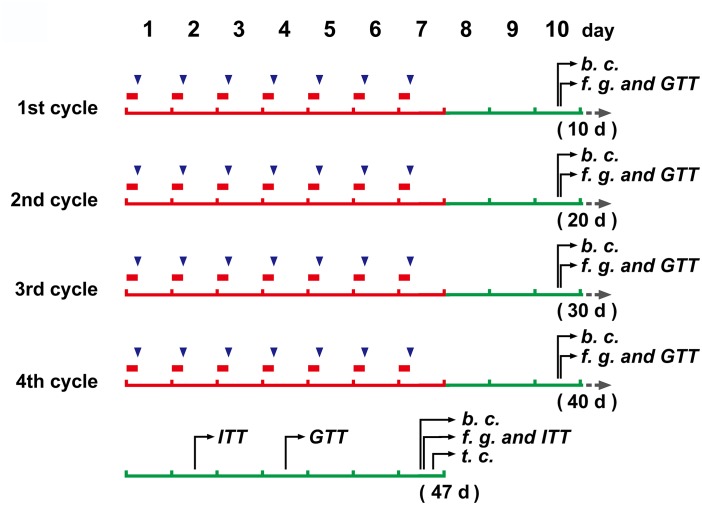
FIGURE 1.
The schedule of main operations and detections of the study.  (in red color), a 6 h restraint;
  , DEX injection (to mice without restraint); b. c., blood collection; f. g., determination of blood glucose levels after fasting; GTT, glucose tolerance test; ITT, insulin tolerance test; t.c., tissue collection.

