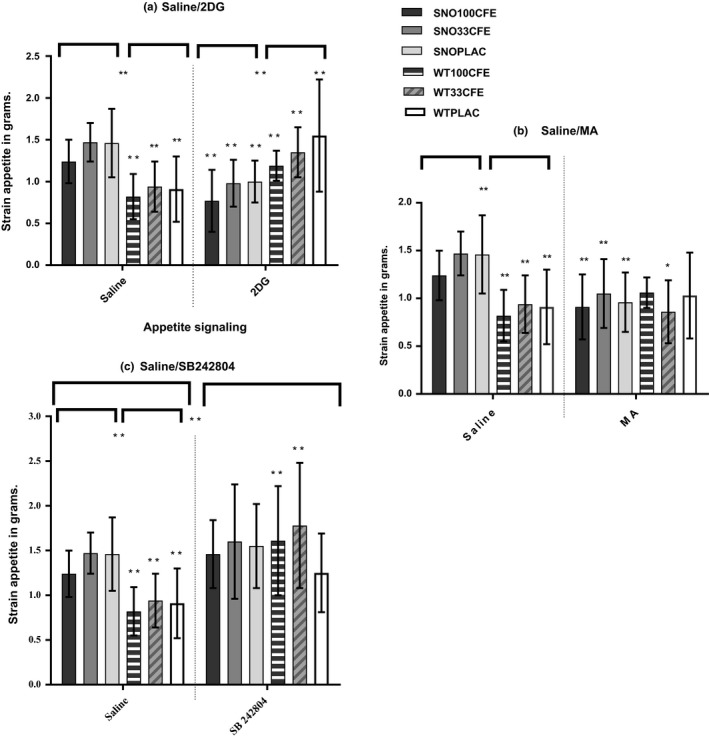
Figure 1.

Appetite Stimulant Histograms. Figure 1 depicts the univariate between‐subject results for appetite signaling tests with SAL—saline control, mean and SD—standard deviation of food ingested in grams in comparison with the appetite signaling reagents 2DG—2‐deoxyglucose, MA—beta‐mercaptoacetate or the 5‐HT2c antagonist SB242804. The results present pairwise comparisons for food ingested over four hours, with significance set as Pillai's trace Sig value, p = ≤0.05, plus t tests between three chronic treatment groups saline versus appetite signaling. The animal models were the Snord116del (SNO) and wild‐type (WT) strains. All animals were ingesting a chronic treatment of either CFE—Caralluma fimbriata extract, at one of two doses 100 mg/kg/d or 33 mg/kg/d or PLAC—placebo of maltodextrin/cabbage leaf [SNO: n = 36; WT: n = 36: (100CFE/M: n = 6 and F: n = 6; 33CFE/M: n = 6 and F: n = 6; and PLAC/M: n = 6 and F: n = 6)]
