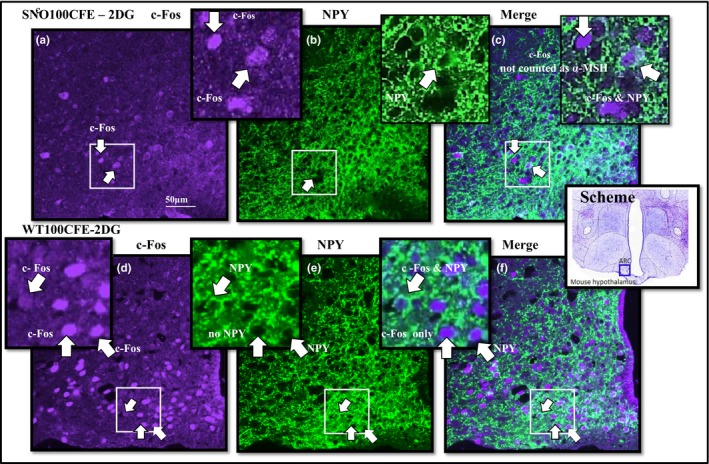
Figure 2.

Immunohistochemistry comparison of strain c‐Fos and NPY cell population. Colocalization of neuropeptide and activity: color image (purple) c‐Fos—Fos‐like early gene expression (green); NPY—neuropeptide Y and c‐Fos in brain slices from the ARC—arcuate nucleus of the hypothalamus in SNO (n = 5)—representative of Snord116del mice and in WT (n = 5)—wild‐type control, ingesting chronic treatment 100CFE—Caralluma fimbriata extract, at 100 mg/kg/d or PLAC—placebo 200 mg maltodextrin and 50 mg cabbage leaf, with food intake stimulant, signaling reagents, 2DG—2‐deoxyglucose, induced by i.p. injection (400 mg/kg, 10 mg =25 g mouse), in comparison with the control SAL—i.p. injection of isotonic saline
