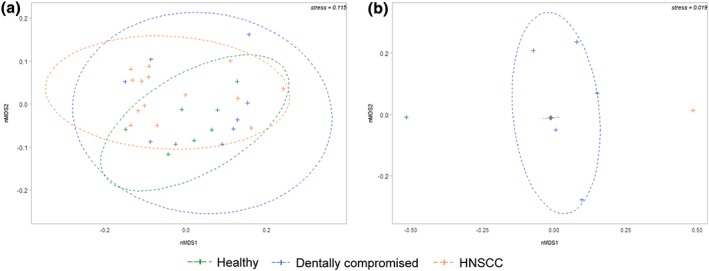
Figure 2.

Bray–Curtis dissimilarity nMDS plots by disease group depicting (a) bacterial beta diversity and (b) fungal beta diversity. Ellipses represent a 95% confidence interval for each disease group. Data that failed subsampling thresholds were excluded, therefore, no ellipse was calculated for healthy controls (n = 2) in (b)
