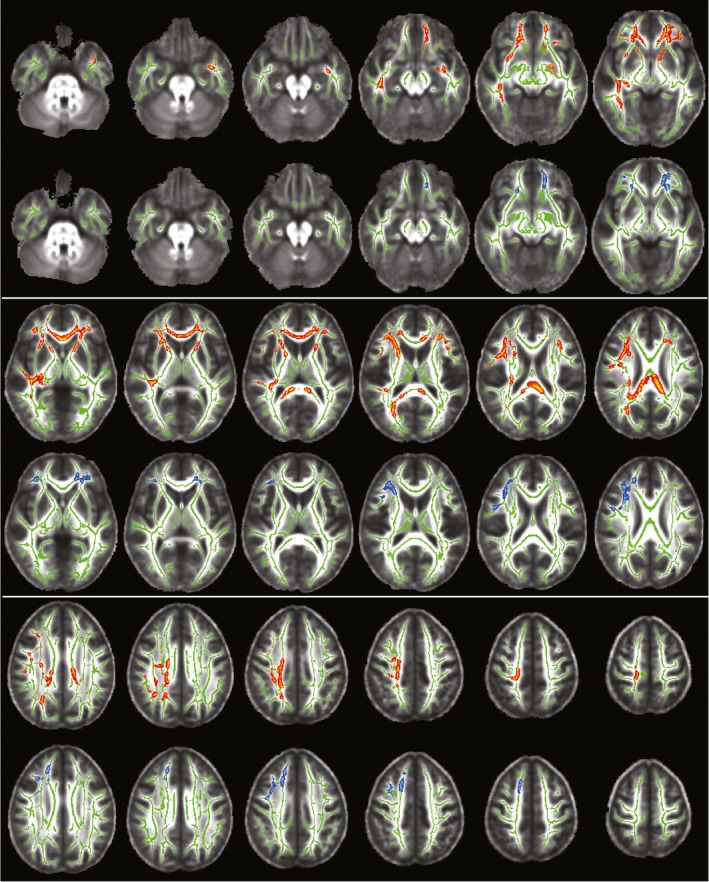
Figure 2.

Results of TBSS analyses on the WM skeleton comparing MD and RD at 2 days and 2 weeks post‐injury to baseline. A diffuse pattern of voxels, displayed in red‐yellow, exhibits significantly higher RD and MD values (corrected p < 0.02) at 2 days post‐injury as compared to baseline. Voxels with significantly higher RD and MD (corrected p < 0.02) at 2 weeks post‐injury as compared to baseline were observed solely in the prefrontal portion of WM fiber tracts, displayed in blue‐light blue. Voxels are inflated into local tracts and overlaid onto the WM skeleton (green) for ease of visualization. The underlay is the mean FA group volume (grayscale). Images are shown in radiological convention (image right =subject's left) for axial slices every 5 mm from MNI slice z = −30 mm (top left image) to z = 55 mm (bottom right image)
