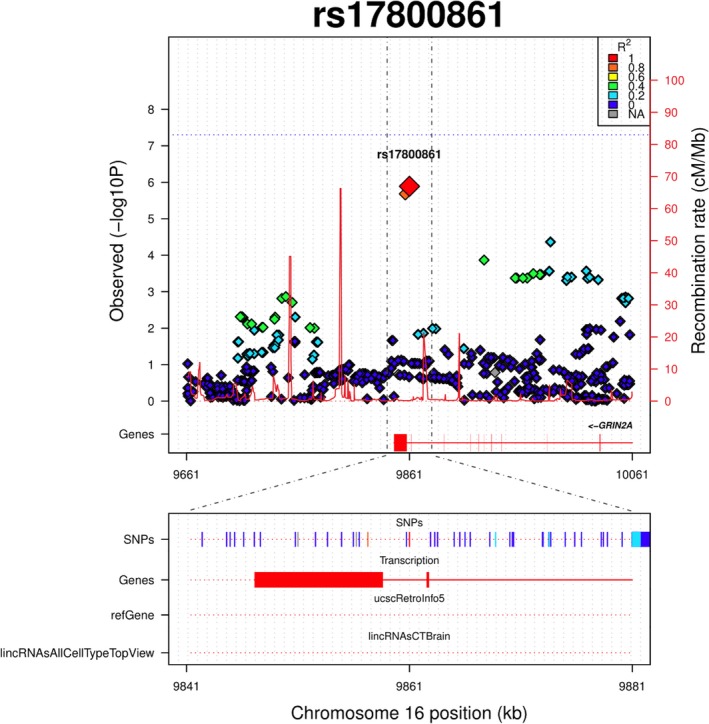
Figure 1.

Regional plot of rs17800861. Variants are plotted by position on chromosome 16 against the observed interaction p‐values for FSIQ measure in the adjusted model. Local LD structure is reflected by estimated recombination rates from the HapMap CEU population (Utah residents with Northern and Western European ancestry plotted in red on the right side). The colors of the variants surrounding rs17800861 are reflecting their LD (according to pairwise r 2 values from the HapMap CEU population). “Genes” refers to protein‐coding genes in the presented region. “refGenes” refers to both protein‐coding and non‐protein‐coding genes reflecting the data from RefSeq UCSC tracks. “lincRNAsAllCellTypeTopView” reflects the data from the lncRNA UCSC tracks in brain tissue
