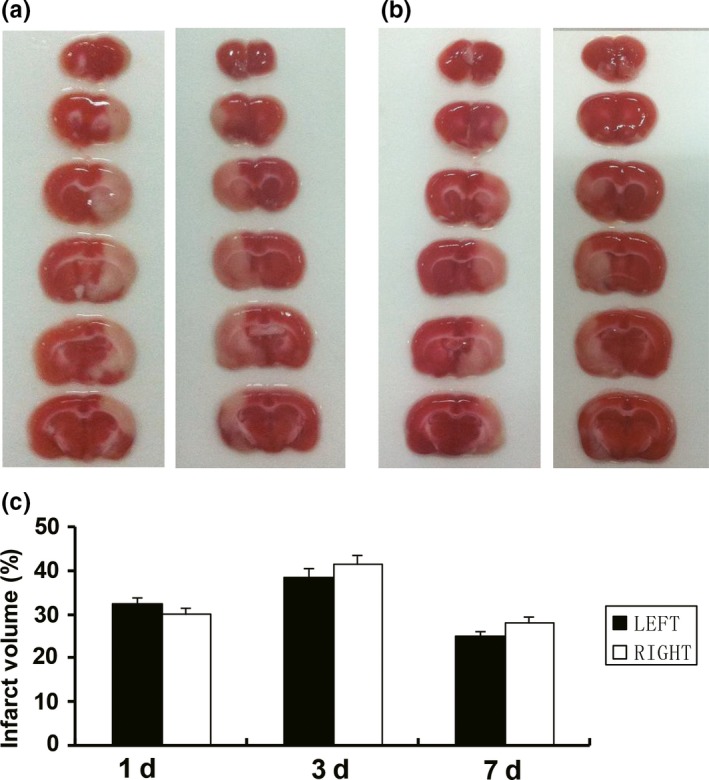
Figure 2.

Comparison of infarction volume between the left and right MCAO groups at 1d, 3d, and 7d after MCAO. (a) Representative sets of TTC‐stained brain slices at 3d after the left and right MCAO, respectively. (b) Representative sets of TTC‐stained brain slices at 7d after the left and right MCAO, respectively. (c) The total brain infarct volume was the largest in 3d post‐MCAO rats, and smallest in 7d post‐MCAO rats. There was no significant difference in the infarct volume between the two groups. Data are presented as the mean ± SD (n = 6)
