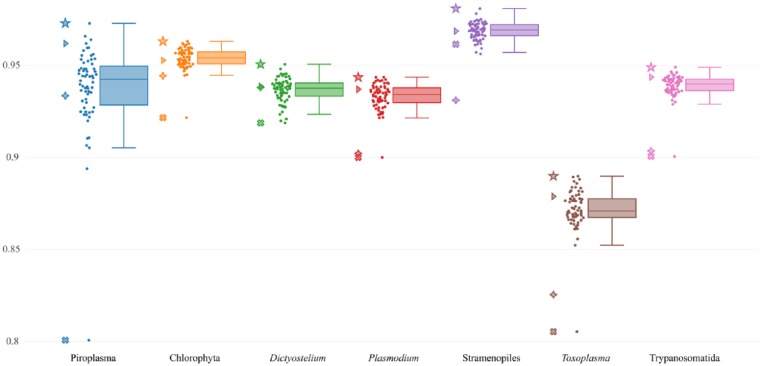
Figure 4.
Boxplot showing the performance of all possible predictors of the mitochondrial proteins for each taxonomic group. The ROC AUC scores (y-axis) of the 7 taxonomic groups possessing mitochondria (x-axis) are plotted. Each closed circle represents the ROC AUC score (y-axis) of each predictor for predicting the mitochondrial proteins of each taxonomic group. Lines within the boxplot indicate the median, the lower/higher quartile (Q1/Q3), and lower/higher whiskers. The star symbols correspond to the scores of the best scoring predictor for each taxonomic group (see Supplementary Table 3). The triangle symbols represent the scores of the predictor trained with the data of all the 7 taxonomic groups. The cross symbols represent the scores of the predictor trained only with the data of the corresponding taxonomic group. The diamond symbols represent the scores of MitoFates.

