Figure 6.
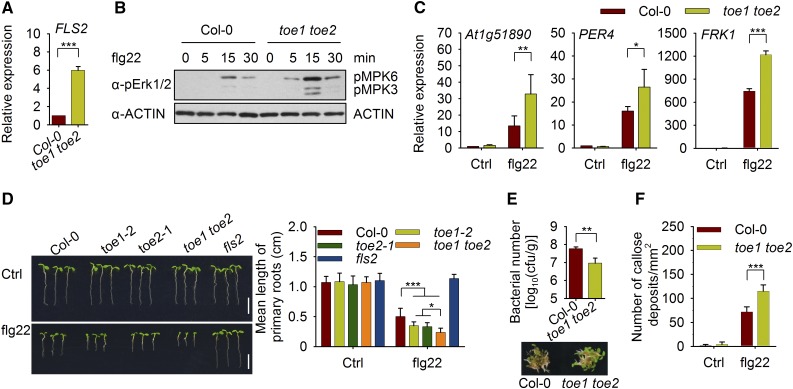
TOE1/2 Negatively Regulate FLS2-Mediated Immunity during Seedling Development.
(A) RT-qPCR analysis of FLS2 expression in 2-d-old Col-0 and toe1 toe2 seedlings. Expression levels were normalized to those of GAPC. Values are means ± sd of three biological replicates using independent pools of seedlings grown under the same conditions. Statistical significance compared with Col-0 was determined by Student’s t tests: ***P < 0.001.
(B) Flg22-induced MAPK activation. Two-day-old Col-0 and toe1 toe2 mutant plants were treated with 100 nM flg22 for the indicated times. MAPK activation was detected by immunoblotting with anti-pErk1/2 antibodies. ACTIN was detected as a loading control. This experiment was repeated three times with similar results.
(C) Flg22-induced gene induction in 2-d-old plants. Col-0 and toe1 toe2 mutant seedlings were treated with 100 nM flg22 for 3 h. The expression of At1g51890, PER4, and FRK1 was analyzed by RT-qPCR, and the expression levels were normalized to those of GAPC. Values are means ± sd of three biological replicates using independent pools of seedlings (45 seedlings per pool) grown under the same conditions. Statistical significance compared with Col-0 was assessed using one-way ANOVA followed by Student-Newman-Keuls tests: *P < 0.05; **P < 0.01; and ***P < 0.001.
(D) Flg22-triggered seedling growth inhibition assay for Col-0, toe1-2, toe2-1, and toe1 toe2 double mutant plants. One-day-old plants were transferred to medium containing 1 μM flg22 and grown for another 5 d. The quantification of growth inhibition is shown in the right panel. Values are means ± sd (n = 12 seedlings). Statistical significance was assessed using one-way ANOVA followed by Student-Newman-Keuls tests: *P < 0.05 and ***P < 0.001. Three independent replicates were performed, and similar results were obtained. Bars = 5 mm.
(E) Growth of Pst DC3000 on Col-0 and toe1 toe2 plants. Two-day-old plants were inoculated with bacteria. Values are means ± sd of three biological replicates using independent seedling samples grown and inoculated under the same conditions. Statistical significance compared with Col-0 was determined by Student’s t tests: **P < 0.01. Representative photographs of Col-0 and toe1 toe2 seedlings infected with Pst DC3000 are shown in the lower panel. cfu, colony-forming units.
(F) Flg22-induced callose deposition in Col-0 and toe1 toe2 plants. Two-day-old plants were treated with 1 μM flg22 for 12 h, and the number of callose deposits was counted using ImageJ. Values are means ± sd (n = 6 leaves from different seedlings). Statistical significance compared with Col-0 was assessed using one-way ANOVA followed by Student-Newman-Keuls tests: ***P < 0.001. Three independent replicates were performed, and similar results were obtained.

